Research Method and Procedure
The questionnaire consists of 50 items in total with the aim to measure demographic, behavioural, psychographic, and motivational dimensions, and preferences.
A 5 Likert scale has been used for all other items where 1 strongly disagrees and 5 strongly agrees.
The demographic and preference items are categorical questions. There is one open question to fill in the nationality and one item with an open answer that measures gender.
| Dimension | Variable | Item | Instrument | Measurement level | Source |
| Novelty | Excitement | The experience allows me to find thrills and excitement. | Seeks to measure the level of novelty that is required from the persona | scale – interval | (Christina, Leonidas, Fotiadis, & Folinas, 2020) |
| Escape | Escape | It allows me to get away from everyday life. | Seeks to identify if escape from routine life is an important factor | scale – interval | (Sato, Kim, Buning, & Harada, 2018) |
| Physical engagement | Physical activity | 1. The experience allows me to be physically active. 2. The adventure experience involves different activities. | Seeks to measure if physical activity is a driving force | scale – interval | (Sato, Kim, Buning, & Harada, 2018) |
| Immersive fantasy | Spontaneity | Decisions are made on the spot regarding the activities to experience. | Seeks to measure the level of playfulness | scale – interval | (Sato, Kim, Buning, & Harada, 2018) |
| Self-reliance | Use of skills | The adventure activity requires specialized skills. | A factor related to hard adventures measuring the level of skills expected by the traveller | scale – interval | (Ponte, Couto, Sousa, Pimentel, & Oliveira, 2021) |
| Unpredictability | Uncertainty | It exposes me to unpredictable weather conditions. | Measures how comfortable travellers are with uncertainty | scale – interval | (Ponte, Couto, Sousa, Pimentel, & Oliveira, 2021) |
| Preparation | Plan | The adventure experience is fully planned. | Measures how comfortable travellers are with an organized program. | scale – interval | (Ponte, Couto, Sousa, Pimentel, & Oliveira, 2021) |
| Nature | Nature | It gives me the opportunity to see wildlife closely. | Measures if getting in touch with nature is a motivational factor | scale – interval | (Sato, Kim, Buning, & Harada, 2018) |
| Culture | Culture | I have the opportunity to experience the local culture (e.g. food, events, people) | Measures if the cultural experience is a motivational factor | scale – interval | (Sato, Kim, Buning, & Harada, 2018) |
| Knowledge | Learning | The experience allows me to learn new things and increase my knowledge. | Seeks to measure if learning is an important factor | scale – interval | (Christina, Leonidas, Fotiadis, & Folinas, 2020) |
| Intrinsic motivations | Competence | I feel capable at what I do. | Measure if competence is a driver for action | scale – interval | (Chen, Vansteenkiste, Beyers, & Boone, 2014) |
| Reversed | I have serious doubts about whether I can do things well. | Measures competence | scale – interval | (Chen, Vansteenkiste, Beyers, & Boone, 2014) | |
| Autonomy | I feel I have been doing what really interests me. | Measure if autonomy is a motivational factor | scale – interval | (Chen, Vansteenkiste, Beyers, & Boone, 2014) | |
| Reversed | My daily activities feel like a chain of obligations. | Measures autonomy | scale – interval | (Chen, Vansteenkiste, Beyers, & Boone, 2014) | |
| Relatedness | I experience a warm feeling with the people I spend time with. | Measures if relatedness is a motivational factor | scale – interval | (Chen, Vansteenkiste, Beyers, & Boone, 2014) | |
| Reversed | I feel that people who are important to me are cold and distant towards me. | Measures relatedness | scale – interval | (Chen, Vansteenkiste, Beyers, & Boone, 2014) | |
| Exercise identity | Exercise | 1. When I describe myself to others, I usually include my involvement in exercise 2. I need to exercise to feel good about myself | Measures the level of exercise | scale – interval | (Wilson & Muon, 2008) |
| Personality | Extraversion | I make friends easily | Measures if the person is extroverted | scale – interval | (Buchanan, Johnson, & Goldberg, 2005) |
| Neuroticism | I panic easily | Measures if the person is neurotic | scale – interval | (Buchanan, Johnson, & Goldberg, 2005) | |
| Conscientiousness | Make plans and stick to them | Measures if the person is organized | scale – interval | (Buchanan, Johnson, & Goldberg, 2005) | |
| Agreeableness | Accept people as they are | Measures if the person is agreeable | scale – interval | (Buchanan, Johnson, & Goldberg, 2005) | |
| Openness | Enjoy hearing new ideas | Measures if the person is open-minded | scale – interval | (Buchanan, Johnson, & Goldberg, 2005) | |
| Online Content | Novelty | Through the content, I satisfied my curiosity regarding the experience (adapted) | Measures if novelty when reading content is a factor when deciding to do an activity | scale – interval | (Chen, Shang, & Li, 2014) |
| Reliability | I think the content is reliable (adapted) | Measures if reliable information is important | scale – interval | (Chen, Shang, & Li, 2014) | |
| Understandability | I am able to follow the content with little effort (adapted) | Measures if understandability of content should be easy | scale – interval | (Chen, Shang, & Li, 2014) | |
| Interesting | I think the content is interesting (adapted) | Measures if the content should be interesting | scale – interval | (Chen, Shang, & Li, 2014) | |
| Intrinsic Motivation | Enjoyment | Using online sources to search for information makes me feel happy (adapted) | Measures if the person feels intrinsically motivated to use online sources for information | scale – interval | (Chen, Shang, & Li, 2014) |
| Intentions | Visit | When I go on a trip, the probability that I visit the destination mentioned in the content is high (adapted) | Measures the visit intentions based on the content | scale – interval | (Chen, Shang, & Li, 2014) |
| Social Media | Before travelling consumption | 1. I looked at activity/attractions reviews of other travellers 2. I read other travellers’ experiences and tips | Measures the social media consumption before the travel | scale – interval | (Amaro, Duarte, & Henriques, 2016) |
| While travelling consumption | I search for travel information on social media websites (for example, things to do or where to eat) | Measures the social media consumption during the travel | scale – interval | (Amaro, Duarte, & Henriques, 2016) | |
| After travelling creation | 1. I write reviews on social media websites 2. I post photos on social media websites | Measures the social media creation behaviour after the travel | scale – interval | (Amaro, Duarte, & Henriques, 2016) | |
| While travelling creation | I check in to the location I am at/update my location on social media. | Measures the social media creation behaviour during the travel | scale – interval | (Amaro, Duarte, & Henriques, 2016) | |
| Preferences | Preferred companions | Alone Friends Family Strangers | Measures if the person likes to travel alone or with companions | nominal | (Ponte, Couto, Sousa, Pimentel, & Oliveira, 2021) |
| Group size | 1-5 people 6-10 people 11-20 people 21+ people | Measures what the preferred group size for the trip is | nominal | (Ponte, Couto, Sousa, Pimentel, & Oliveira, 2021) | |
| Level of independence | 1. Independently (alone or with my group) 2. With a specialized freelance guide 3. With a specialized company | Measures if the person seeks to travel alone, with a guide, or with a company | nominal | (Ponte, Couto, Sousa, Pimentel, & Oliveira, 2021) | |
| Demographics | Nationality | Open question | Measures the sample’s nationality | open-ended | (Ponte, Couto, Sousa, Pimentel, & Oliveira, 2021) |
| Gender | Male Female Open question | Measures the gender representativity | nominal | (Ponte, Couto, Sousa, Pimentel, & Oliveira, 2021) | |
| Age | Under 18 19-34 35-44 45-54 55-64 65 and up | Measures the age representativity | scale – ratio | (Ponte, Couto, Sousa, Pimentel, & Oliveira, 2021) | |
| Education | Under High School High School Bachelor Degree Master Degree Doctorate Degree | Measures the level of education | nominal | (Ponte, Couto, Sousa, Pimentel, & Oliveira, 2021) | |
| Income | Less than 20,000 € 20,000 € – 34,999 € 35,000 € – 49, 999 € 50,000 € – 64, 999 € 65, 000 € and up | Measures the income | scale – ratio | (Ponte, Couto, Sousa, Pimentel, & Oliveira, 2021) | |
| Risk | What is the level of risk you need to feel stimulated during adventure activities? | Explores if the participant can be identified as a soft or hard adventurer | scale – interval | / | |
| Filter | Brand awareness | Have you travelled with the [company name] before? | Measures customer representativity | nominal | / |
| Filter | Experience | When travelling, are you willing to visit little-known places? | Measures inclinations to experience local life relevant to the business model of the company’s | nominal | / |
The survey was spread on multiple Facebook groups with a focus on adventure and outdoor activities including hiking, backpacking, kayaking, mountaineering, and swimming.
The groups were located around the globe with members from Europe, North America, Australia, Africa, and Asia.
The sampling method was convenience sampling as the response rate was achieved more efficiently.
Reliability
All questions are taken from published articles on sciencedirect.com. Some have been adjusted slightly to fit the context of the current research. And most items have been tested for internal consistency using Cronbach’s alpha tests.
Validity
The validity of the instrument was ensured by using concepts from constructs reviewed in the literature in tourism, psychology, and the internet and communication technologies.
Quantitative Analysis
Demographics
The research utilized standard demographic questions that display the representativity of the sample. The questions gather data on age, nationality, gender, level of education, and annual gross income.
Questions related to the demographics were taken from a study on adventure tourism experiences (Ponte, Couto, Sousa, Pimentel, & Oliveira, 2021).
Preferences
Three items related to the preferences of the participants were used to obtain data on preferred travelling companions and individual travellers and the ideal group size, and if they prefer to do activities independently, with a freelance guide, or with a specialized company (Ponte, Couto, Sousa, Pimentel, & Oliveira, 2021).
Motivations
The motivational dimensions in tourism have been categorized into three pillars.
Customer-based are those motivations which satisfy the customer needs, product-based are related to motivations met through the product and hybrid dimensions that result from the product features and customer needs and wants (Janowski, Gardiner, & Kwek, 2021).
A few concepts from different studies that refer to the framework for dimension categorizations have been used to evaluate the needs of the target audience.
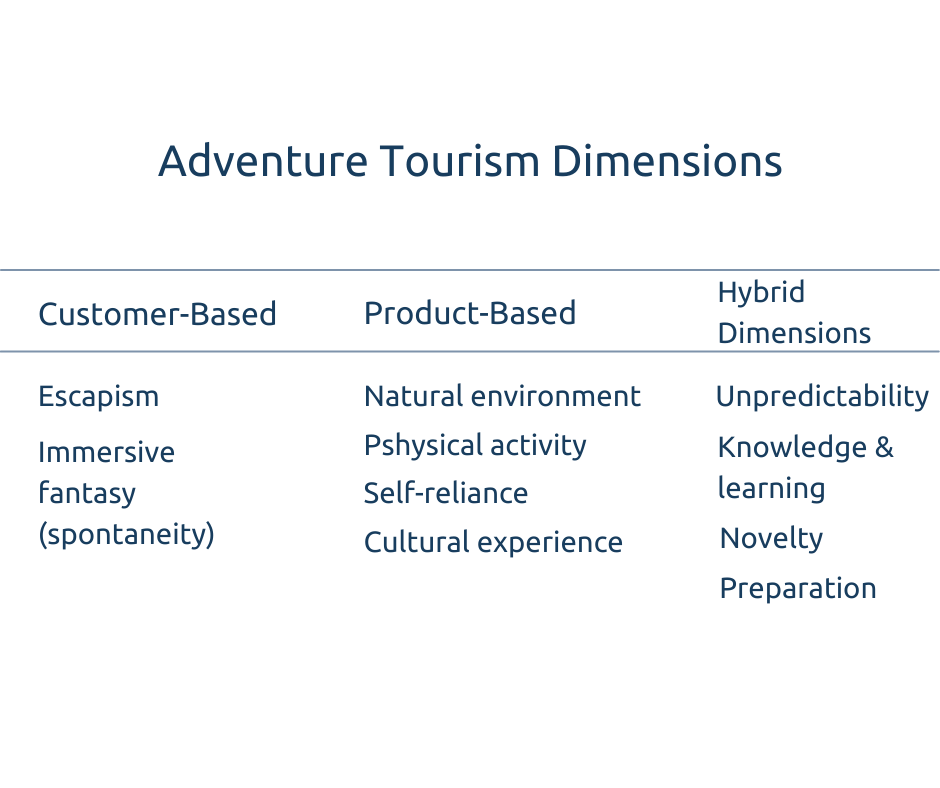
The dimensions cover the need for escape (Sato, Kim, Buning, & Harada, 2018) from daily obligations and stress, the need for spontaneity and being immersed in the activity (Ponte, Couto, Sousa, Pimentel, & Oliveira, 2021), the opportunity to experience wildlife closely and connect to nature (Sato, Kim, Buning, & Harada, 2018), the physical engagement and challenge (Sato, Kim, Buning, & Harada, 2018).
Self-reliance measures the degree to which the participant is motivated to rely on their own skills (Ponte, Couto, Sousa, Pimentel, & Oliveira, 2021) to overcome the physical challenge. Cultural experience refers to the motivation to experience another culture (Sato, Kim, Buning, & Harada, 2018) and it is closely related to knowledge (Christina, Leonidas, Fotiadis, & Folinas, 2020) where the traveller wants to learn new skills or information in general.
Then in the hybrid dimension, the motivations are unpredictability (Ponte, Couto, Sousa, Pimentel, & Oliveira, 2021) and novelty (Christina, Leonidas, Fotiadis, & Folinas, 2020) that offers variety and excitement, and preparation (Ponte, Couto, Sousa, Pimentel, & Oliveira, 2021) that is connected to need for safety.
Some dimensions like self-reliance and unpredictability have been linked to hard adventure experiences while novelty, physical activity, challenge, and natural environment are associated with the needs of soft adventure travellers (Christina, Leonidas, Fotiadis, & Folinas, 2020).
In a different framework, dimensions are also classified as push motivations while others like “Nature” and “Culture” defined in research by Sato and colleagues (2018) are classified as pull motivations meaning that some needs are those that “push” (Sato, Kim, Buning, & Harada, 2018) the adventurer to do the activity, e.g., psychological needs like getting a rest while others “pull” (Sato, Kim, Buning, & Harada, 2018) the traveller towards the activity, e.g., the benefit of learning new skills.
Behavioural
In an online context, consumer behaviours often refer to searching for content (e.g., reading reviews) and creating content (e.g., writing reviews) (Amaro, Duarte, & Henriques, 2016).
A driver for content search and creation has been identified as an intrinsic motivation to use online sources for the fun of it coded as ‘enjoyment’ in the behavioural variables (Chen, Shang, & Li, 2014). The motivation should be high in the target market for the behaviours of content search and creation to be exhibited (Amaro, Duarte, & Henriques, 2016).
Additionally, the customer’s inclination to visit the destination by reading about it online and the content needs that they can describe as ‘novel’, ‘reliable’, ‘easy to understand’, and ‘interesting’ have been measured through the questionnaire (Chen, Shang, & Li, 2014).
Psychographics
The data will provide an insight into which needs are important for the different clusters, so they can be expressed through visual and textual information and satisfied through the actual service, consequently leading to an increase in eudaimonic well-being (Hao & Xiao, 2021) that results in psychological growth and satisfaction (Ryan & Deci, 2001), and change in behavioural intentions.
The intrinsic motivations, personality traits, and exercise identity of the target audience are analyzed in the psychographics.
Intrinsic motivations such as competence, autonomy, and relatedness are important as they are connected to the needs in the value that the service brings, and the brand associations through the service features and can be communicated to the message in the content and media strategy. Six items measure the three dimensions, while three of the six items have been reversed (Chen, Vansteenkiste, Beyers, & Boone, 2014).
In addition, the two items were included as a part of the “Exercise Identity Scale” (Wilson & Muon, 2008) to measure how actively engaged the target audience is and if they identify as a physically active person.
Finally, an item for each one of the 5 dimensions of the Big 5 personality inventory (Buchanan, Johnson, & Goldberg, 2005) was included in the questionnaire to measure the personality traits of the participants. In fact, people with higher rates of openness (Audet, Levine, Metin, Koestner, & Barcan, 2021) has been previously shown a greater online engagement that goes back to the behavioural intentions of using online sources.
Filter Items
The questions are used to measure if the persona is interested in the service of the provider. And another item seeks to measure the perceived level of risk that the participant feels comfortable with as physical activities often carry a degree of risk that is measured from very low to very high (Bentley & Page, 2008).
Limitations
The population is focused on adventure travellers with different backgrounds, ages, and incomes. Further research and greater sample size are needed to be able to make a more accurate generalization. Additionally, the data on income was relatively less as more people decided not to share this information. Thus, it may lead to inaccuracies in the interpretation.
Data Analysis
The data from the questionnaire was prepared in Excel before importing it to SPSS.
In total 172 responses were collected.
The very first two of the responders’ answers were used for testing the questionnaire, while 4 were filtered out as participants indicated that they are not interested in the service of the client, so they failed the filter check and did not match the profile of the target market.
After exporting the data in Excel, the questions that had a different measurement level than scales (1 to 5) were coded with corresponding values.
The cluster analysis was performed using the adjusted data. The clusters were grouped on motivations and perceived levels of risk.
The reason for choosing the level of risk is that travellers are usually classified into soft and hard adventurous travellers depending on the level of risk of the activity. Some activities carry a higher level of risk (e.g. paragliding) while other activities are considered less risky (e.g. biking).
Those variables were also used during interviews to fit interviewees with the right group depending on their priorities.
The degree of risk is used to differentiate between clusters of soft and hard adventurers (Pomfret, 2019). Then different solutions were tested. The cluster analysis was performed 5 times in total.
Since the distances from the cluster centres got shorter after the 5th solution, a decision was made between the 3rd and 4th cluster solutions using a heat map.
I made a decision to stick with four clusters after carefully observing the differences in the motivations of the groups and I noticed that the distances between the clusters were at their most optimal point when the clusters were four.
Tradeoff: Additionally, I doubted two of the clusters as they showed very similar results, but I made a decision to go forward with four clusters as I saw that one of them scored very high on the culture variable which was a major difference from the other three groups. And while profiling the groups I discovered more differences in age and income. That confirmed that the two clusters were different.
| Distances between Final Cluster Centers | ||||
| Cluster | 1 | 2 | 3 | 4 |
| 1 | 2,185 | 2,246 | 3,019 | |
| 2 | 2,185 | 2,531 | 2,756 | |
| 3 | 2,246 | 2,531 | 2,460 | |
| 4 | 3,019 | 2,756 | 2,460 | |
| Anova F scores | 1 | Spontaneity | 49,42762 | |
| 2 | Unpredictability | 40,53136 | ||
| 3 | Knowledge | 23,839525 |
Then, the clusters were profiled using crosstabs for the analysis of demographics and mean scores for the analysis of the psychographic and behavioural variables.
Results
Motivations
Based on the motivations and the perceived level of risk, four distinct clusters were identified. The strongest factors that had an influence in determining the groups are the motivations for spontaneity, unpredictability, and knowledge. Based on those factors, the groups are formed by being either low or high on those motivations. The motivation for escape, knowledge, and culture were the strongest among the four groups apart from culture being of neutral interest to group 1.
The following 4 groups are identified:
- Escapist Travellers (Cluster 1)
The respondents in this group have given high scores for the motivations for escape and excitement, they can be considered ‘escapists’ since those motivations are often tied up together for travellers who look to escape from daily life, stress, and routine. Therefore, they naturally look for activities that will allow them to disconnect and change from their routines and offer them fun and excitement. Additionally, they scored approximately high on their desire to see nature and gain new knowledge.
- ‘Safety first!’ Adventurers (Cluster 2)
This cluster has been identified for its strong desire for predictability, preparation, and low spontaneity. Thus, the ‘Safety First!’ name was given to identify the desire for control and safety that are not shared by other groups.
- Culture Explorers (Cluster 3)
The Culture Explorers are interested in getting to know the locals, the food, and the way people live in the area. Additionally, they prefer being moderately prepared and very spontaneous. Still, the desire for culture is the one that distinguished them the most from other groups as it was the highest-ranking motivation for this group.
- Real Adventurers (Cluster 4)
Besides the holy trio (escape, knowledge, culture) this group of people also ranked high their motivations for seeing nature and wildlife, being spontaneous, and being able to tolerate unpredictable weather (unpredictability) a lot better than the other three groups. There were no real low scores for the motivations in this group. Thus, they were named ‘Real Adventurers’ for their love of nature, excitement, spontaneity, unpredictability, and medium to high level of risk.
Based on the results, the Real Adventurers score highest (3.62) on unpredictability, and highest on self-reliance (3.38), although the result is not enough to be considered a motivational need.
Nonetheless, the group is the closest one to the ideal for hard adventure travellers while the other three groups are closest to the ideal for soft adventure travellers as classified by the framework (Christina, Leonidas, Fotiadis, & Folinas, 2020).
I also analysed the rest of the variables from the table including the psychographics, behavioural, and demographic data. And created a persona infographic that I used when strategizing the organizational alignment and creating content formats.
Some of the data is confidential, so I couldn’t share the full story. If you would like to know more, please get in touch with me.
UX Content Strategy ↗
See how we raise awareness and build expertise to meet the objectives of an adventure travel company by applying design thinking principles.
Behind-the-Scenes↗
Discover how I gathered quantitative and qualitative data about the target audience of an adventure travel company.
About & Contact ↗
Get to know my experience and contact me.